FOCUS: ANALYSIS IN PERSON WORKSHOP
Today’s workshop began, as usual, with a reminder to signpost what we should be doing to progress our Action Research Projects (ARPs), with Mallika emphasising the importance of time management. This remains one of my most significant personal challenges (a lifetime of procrastination!), and it framed how I engaged with the session. Mallika and Kwame invited us to reflect on how we were feeling using an emotional colour wheel, prompting an open discussion about emotional states in relation to research. While one of my peers expressed anxiety, I felt unexpectedly hopeful. (Weird for me!) This acknowledgement of emotional positioning and honesty in the group emphasised the importance of not working in isolation and of recognising affect as part of the research process.
Establishing that we were all actually ‘okay’, Mallika and Kwame then returned us to the practicalities of analysis, emphasising the need to map research timelines and reflect critically on where we were with our projects. They introduced the six phases of reflexive thematic analysis (Braun & Clarke, 2022), describing the process as interpretive, creative and situated. The framing of this method helped me understand analysis not as a detached or technical task, but as an active process of sense-making that develops in parallel with the research.
This understanding was reinforced through the session’s core reading, Ch.5, Interpreting the Map, methods of evaluation and analysis, from Visualising Research by Gray and Malins (2004). The authors position analysis and interpretation as central to practice-based research, defining interpretation as the process of identifying patterns, relationships and meanings within data rather than simply reporting findings. They emphasise that interpretation is iterative and reflective, requiring movement between data, theory and practice. Visual strategies such as mapping, clustering, and diagrams are presented as tools for revealing connections that may not be immediately apparent from text alone. I found the examples of idiosyncratic diagrams to demonstrate a diversity in visual research to be both engaging and informative. It highlighted for me how analytical tools can emerge from and be shaped by specific research contexts.
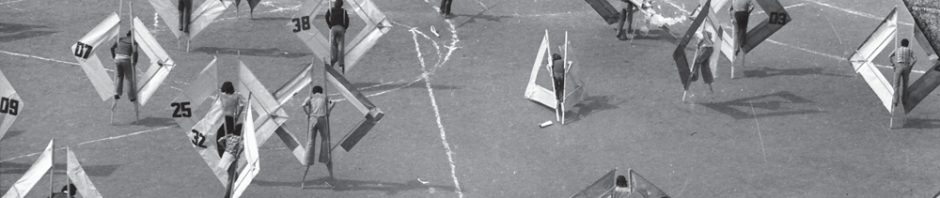
Illustrations, above from Ch.5, Interpreting the Map, methods of evaluation and analysis, from Visualising Research by Gray and Malins (2004). I really appreciated the distinctive, eccentric illustrative responses to understanding research within core text.
Gray and Malins also stress the influence of researcher positionality on interpretation, reinforcing the subjective yet rigorous nature of creative research. This prompted me to consider how my own background, experiences, and assumptions might shape my analysis of the data that I was yet to receive. At this stage, I began to think more about how I might plan, analyse and present data.
Mallika acknowledged that there is no single approach to analysis, drawing on her own research practice using children’s drawings as an example. This further highlighted the interpretive complexity of visual data and reaffirmed the relevance of Gray and Malins’ framework approach. I recognised that my own project would involve participatory methods, likely generating both written and visual responses. At the time, this helped me begin to visualise analysis as a multi-layered, responsive process.
Kwame reminded us that we must account for bias within our analysis. While researcher subjectivity cannot be eliminated, it must be acknowledged and justified.
A live data analysis activity helped to ground this discussion. Working in a small group, we analysed anonymised student feedback collected by Chuck to support the development of an inclusivity manifesto for her action research project. This exercise revealed how participant effects can influence data, including social desirability bias and the tendency for feedback to function as a barometer rather than a reflective response. I was intrigued by this and keen to understand more. I discovered that ‘Participant effects’ within qualitative research refer to being in a study can change people’s behaviour, thoughts, or responses, introducing bias, with key examples being the Hawthorne Effect (changing behaviour when observed), Social Desirability Bias (wanting to look good), and Demand Characteristics (guessing the researcher’s expectations). I felt that I would adopt approaches to mitigate this effect in my activity, aiming to achieve clear, clean data.
Reflecting on this activity, I became more aware of the need to carefully design my own research methods to mitigate such effects. For me, the workshop ultimately clarified analysis as a reflective, interpretive and ethically situated practice, reinforcing its central role in producing meaningful and credible outcomes within my own action research project.
References
Gray, C. and Malins, J. (2004) Visualising Research; Chapter 5, Interpreting the map, methods of evaluation and analysis.
Braun, V. and Clarke, V. (2022) Thematic analysis: A practical guide. Los Angeles: SAGE.
https://en.wikipedia.org/wiki/Hawthorne_effect
https://www.sciencedirect.com/topics/psychology/social-desirability-bias